
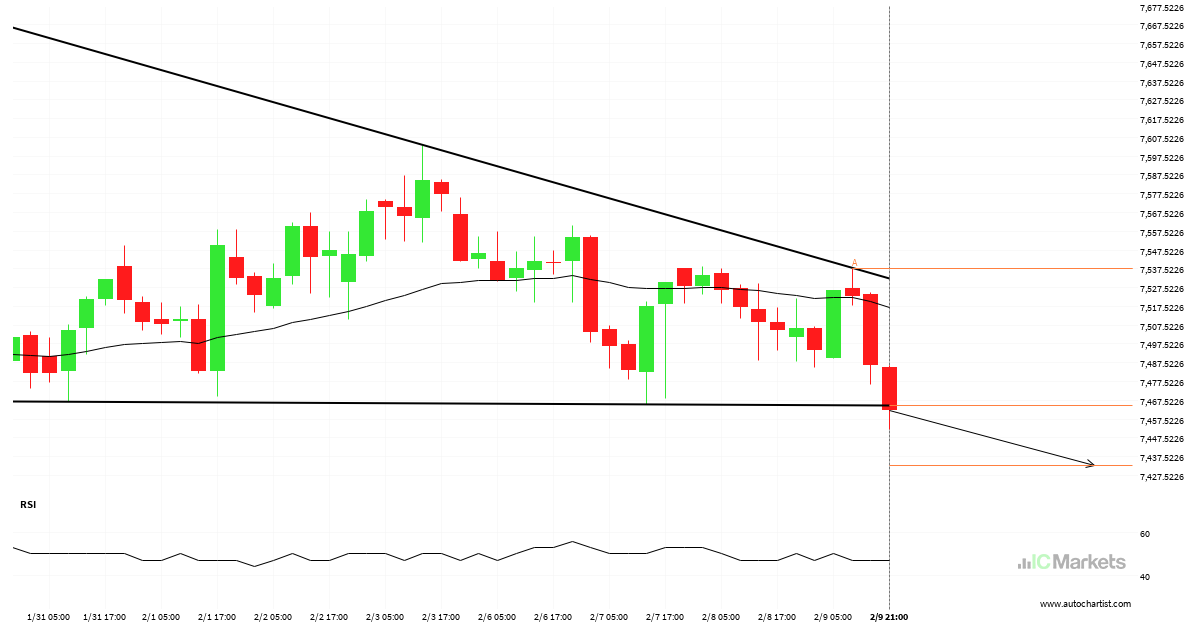
A possible start of a bearish trend on Australia 200 Index
Australia 200 Index has broken through a support line of a Descending Triangle chart pattern. If this breakout holds true, we may see the price of Australia 200 Index testing 7432.9551 within the next 3 days. But don’t be so quick to trade, it has tested this line in the past, so you should confirm […]

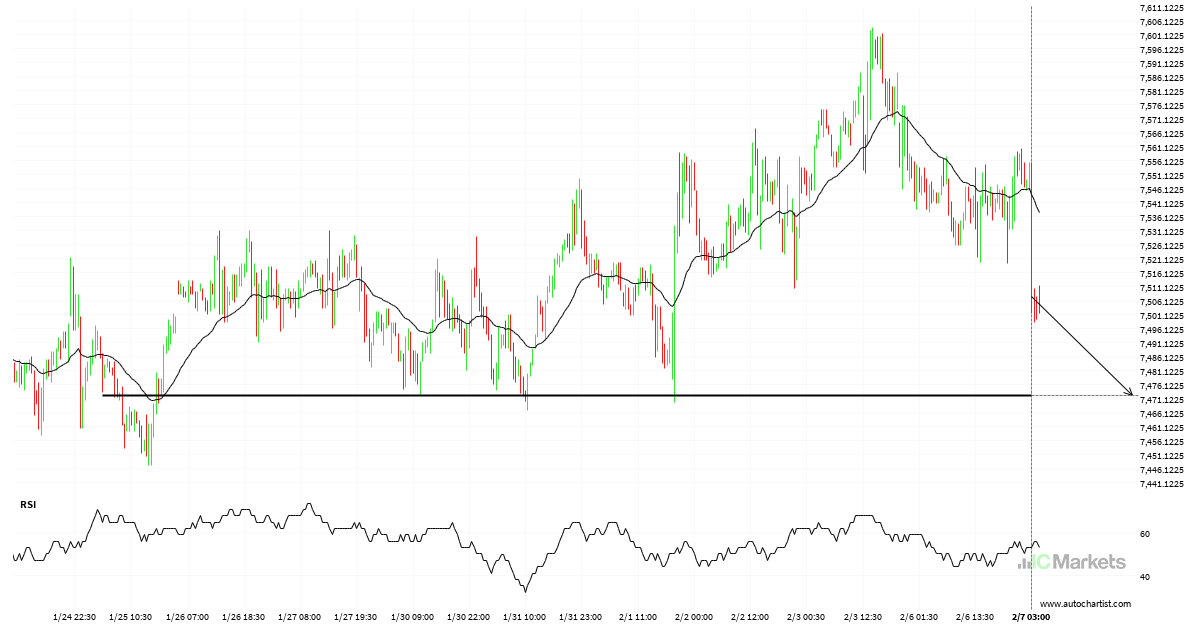
Will Australia 200 Index have enough momentum to break support?
Australia 200 Index is heading towards the support line of a Head and Shoulders and could reach this point within the next 3 days. It has tested this line numerous times in the past, and this time could be no different from the past, ending in a rebound instead of a breakout. If the breakout […]

Resistance line breached by FTSE China A50 Index
FTSE China A50 Index has broken through the resistance line which it has tested twice in the past. We have seen it retrace from this line before, so one should wait for confirmation of the breakout before trading. If this new trend persists, a target level of around 13695.8874 may materialize within the next 12 […]
A final push possible on Australia 200 Index
Australia 200 Index is heading towards 7472.1099 and could reach this point within the next 2 days. It has tested this line numerous times in the past, and this time could be no different, ending in a rebound instead of a breakout. If the breakout doesn’t happen, we could see a retracement back down to […]
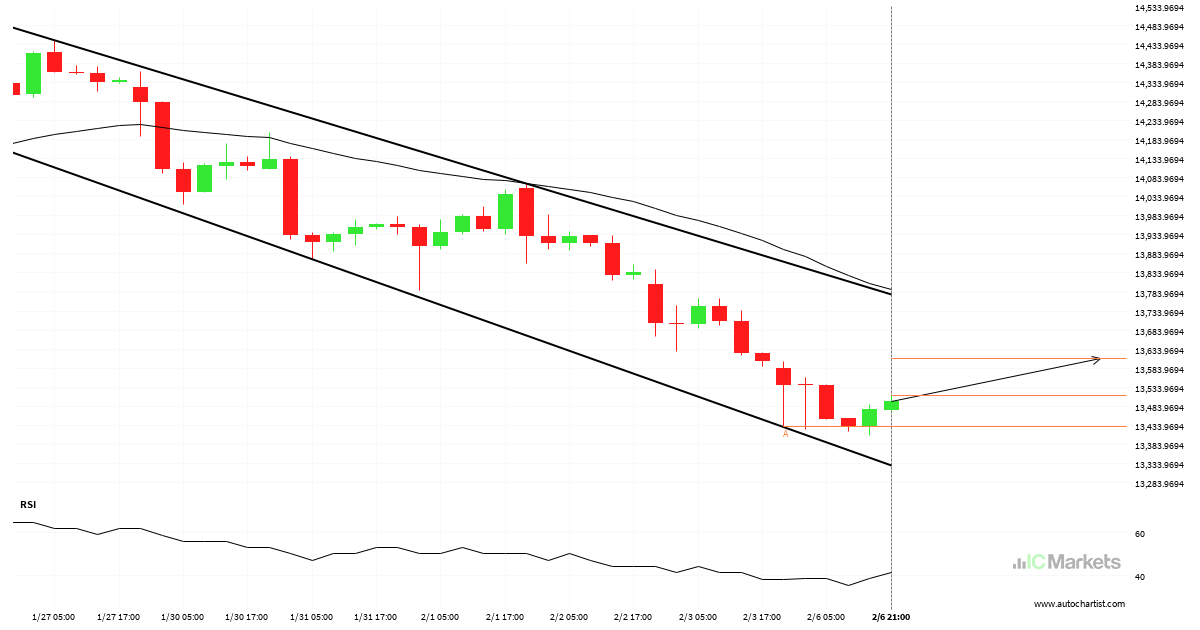
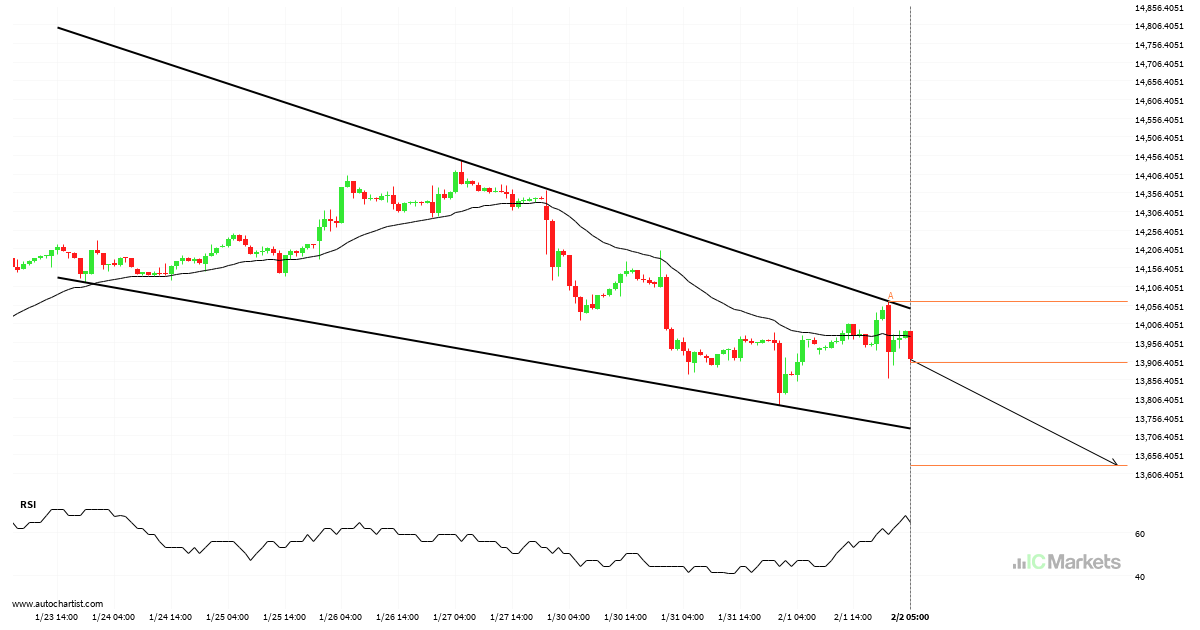
Will FTSE China A50 Index have enough momentum to break resistance?
FTSE China A50 Index is heading towards the resistance line of a Channel Down and could reach this point within the next 3 days. It has tested this line numerous times in the past, and this time could be no different from the past, ending in a rebound instead of a breakout. If the breakout […]
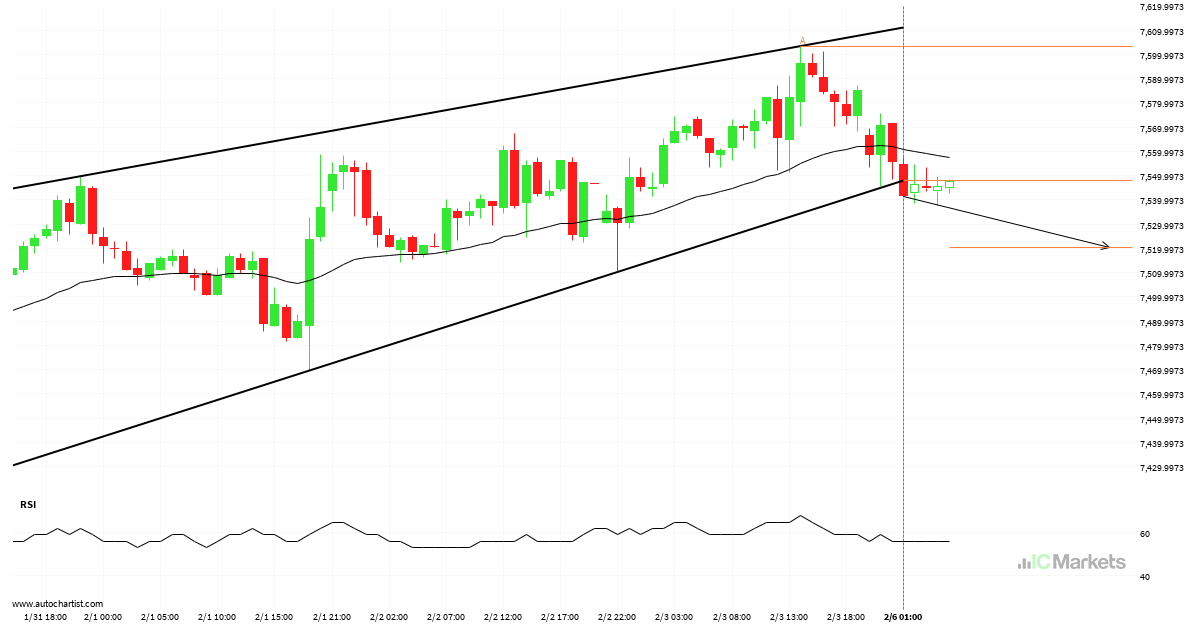
Australia 200 Index – support line breached
Australia 200 Index has broken through the support line of a Rising Wedge technical chart pattern. Because we have seen it retrace from this line in the past, one should wait for confirmation of the breakout before taking any action. It has touched this line twice in the last 6 days and suggests a possible […]

Hong Kong 50 Index approaching support of a Falling Wedge
Hong Kong 50 Index is approaching the support line of a Falling Wedge. It has touched this line numerous times in the last 4 days. If it tests this line again, it should do so in the next 16 hours.

Hong Kong 50 Index – getting close to psychological price line
Hong Kong 50 Index is moving towards a support line. Because we have seen it retrace from this level in the past, we could see either a break through this line, or a rebound back to current levels. It has touched this line numerous times in the last 21 days and may test it again […]
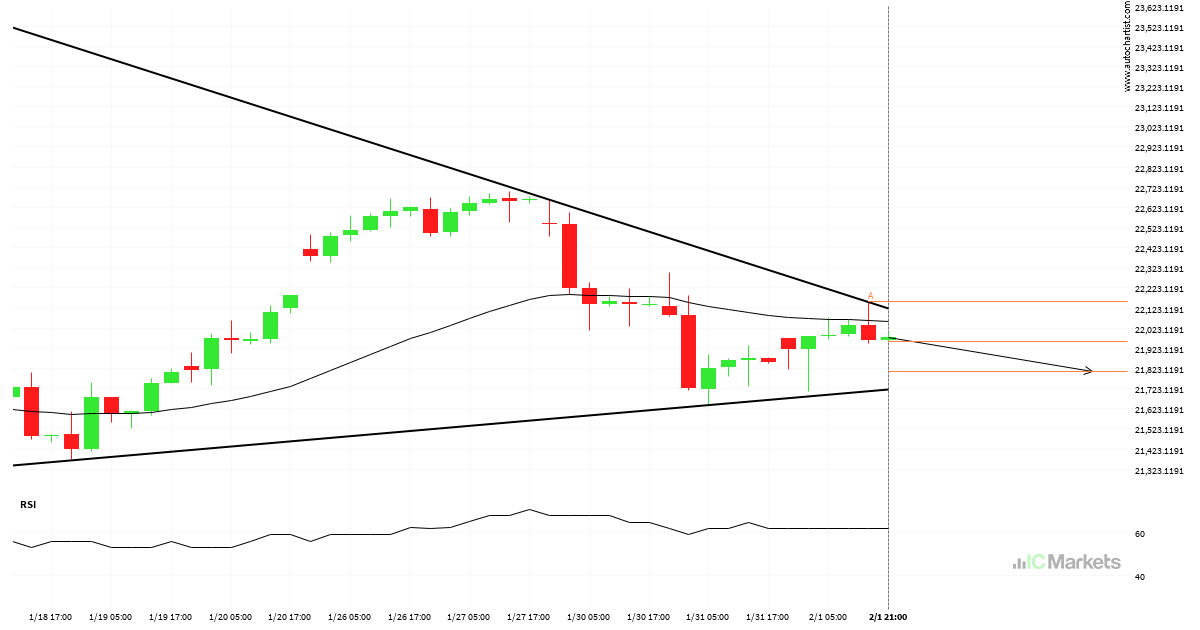
Possible breach of support level by FTSE China A50 Index
FTSE China A50 Index is moving towards a support line which it has tested numerous times in the past. We have seen it retrace from this line before, so at this stage it isn’t clear whether it will breach this line or rebound as it did before. If FTSE China A50 Index continues in its […]
Hong Kong 50 Index approaching support of a Triangle
Hong Kong 50 Index is approaching the support line of a Triangle. It has touched this line numerous times in the last 16 days. If it tests this line again, it should do so in the next 3 days.